On this page you can find lots of different baseball-related things I have worked on.
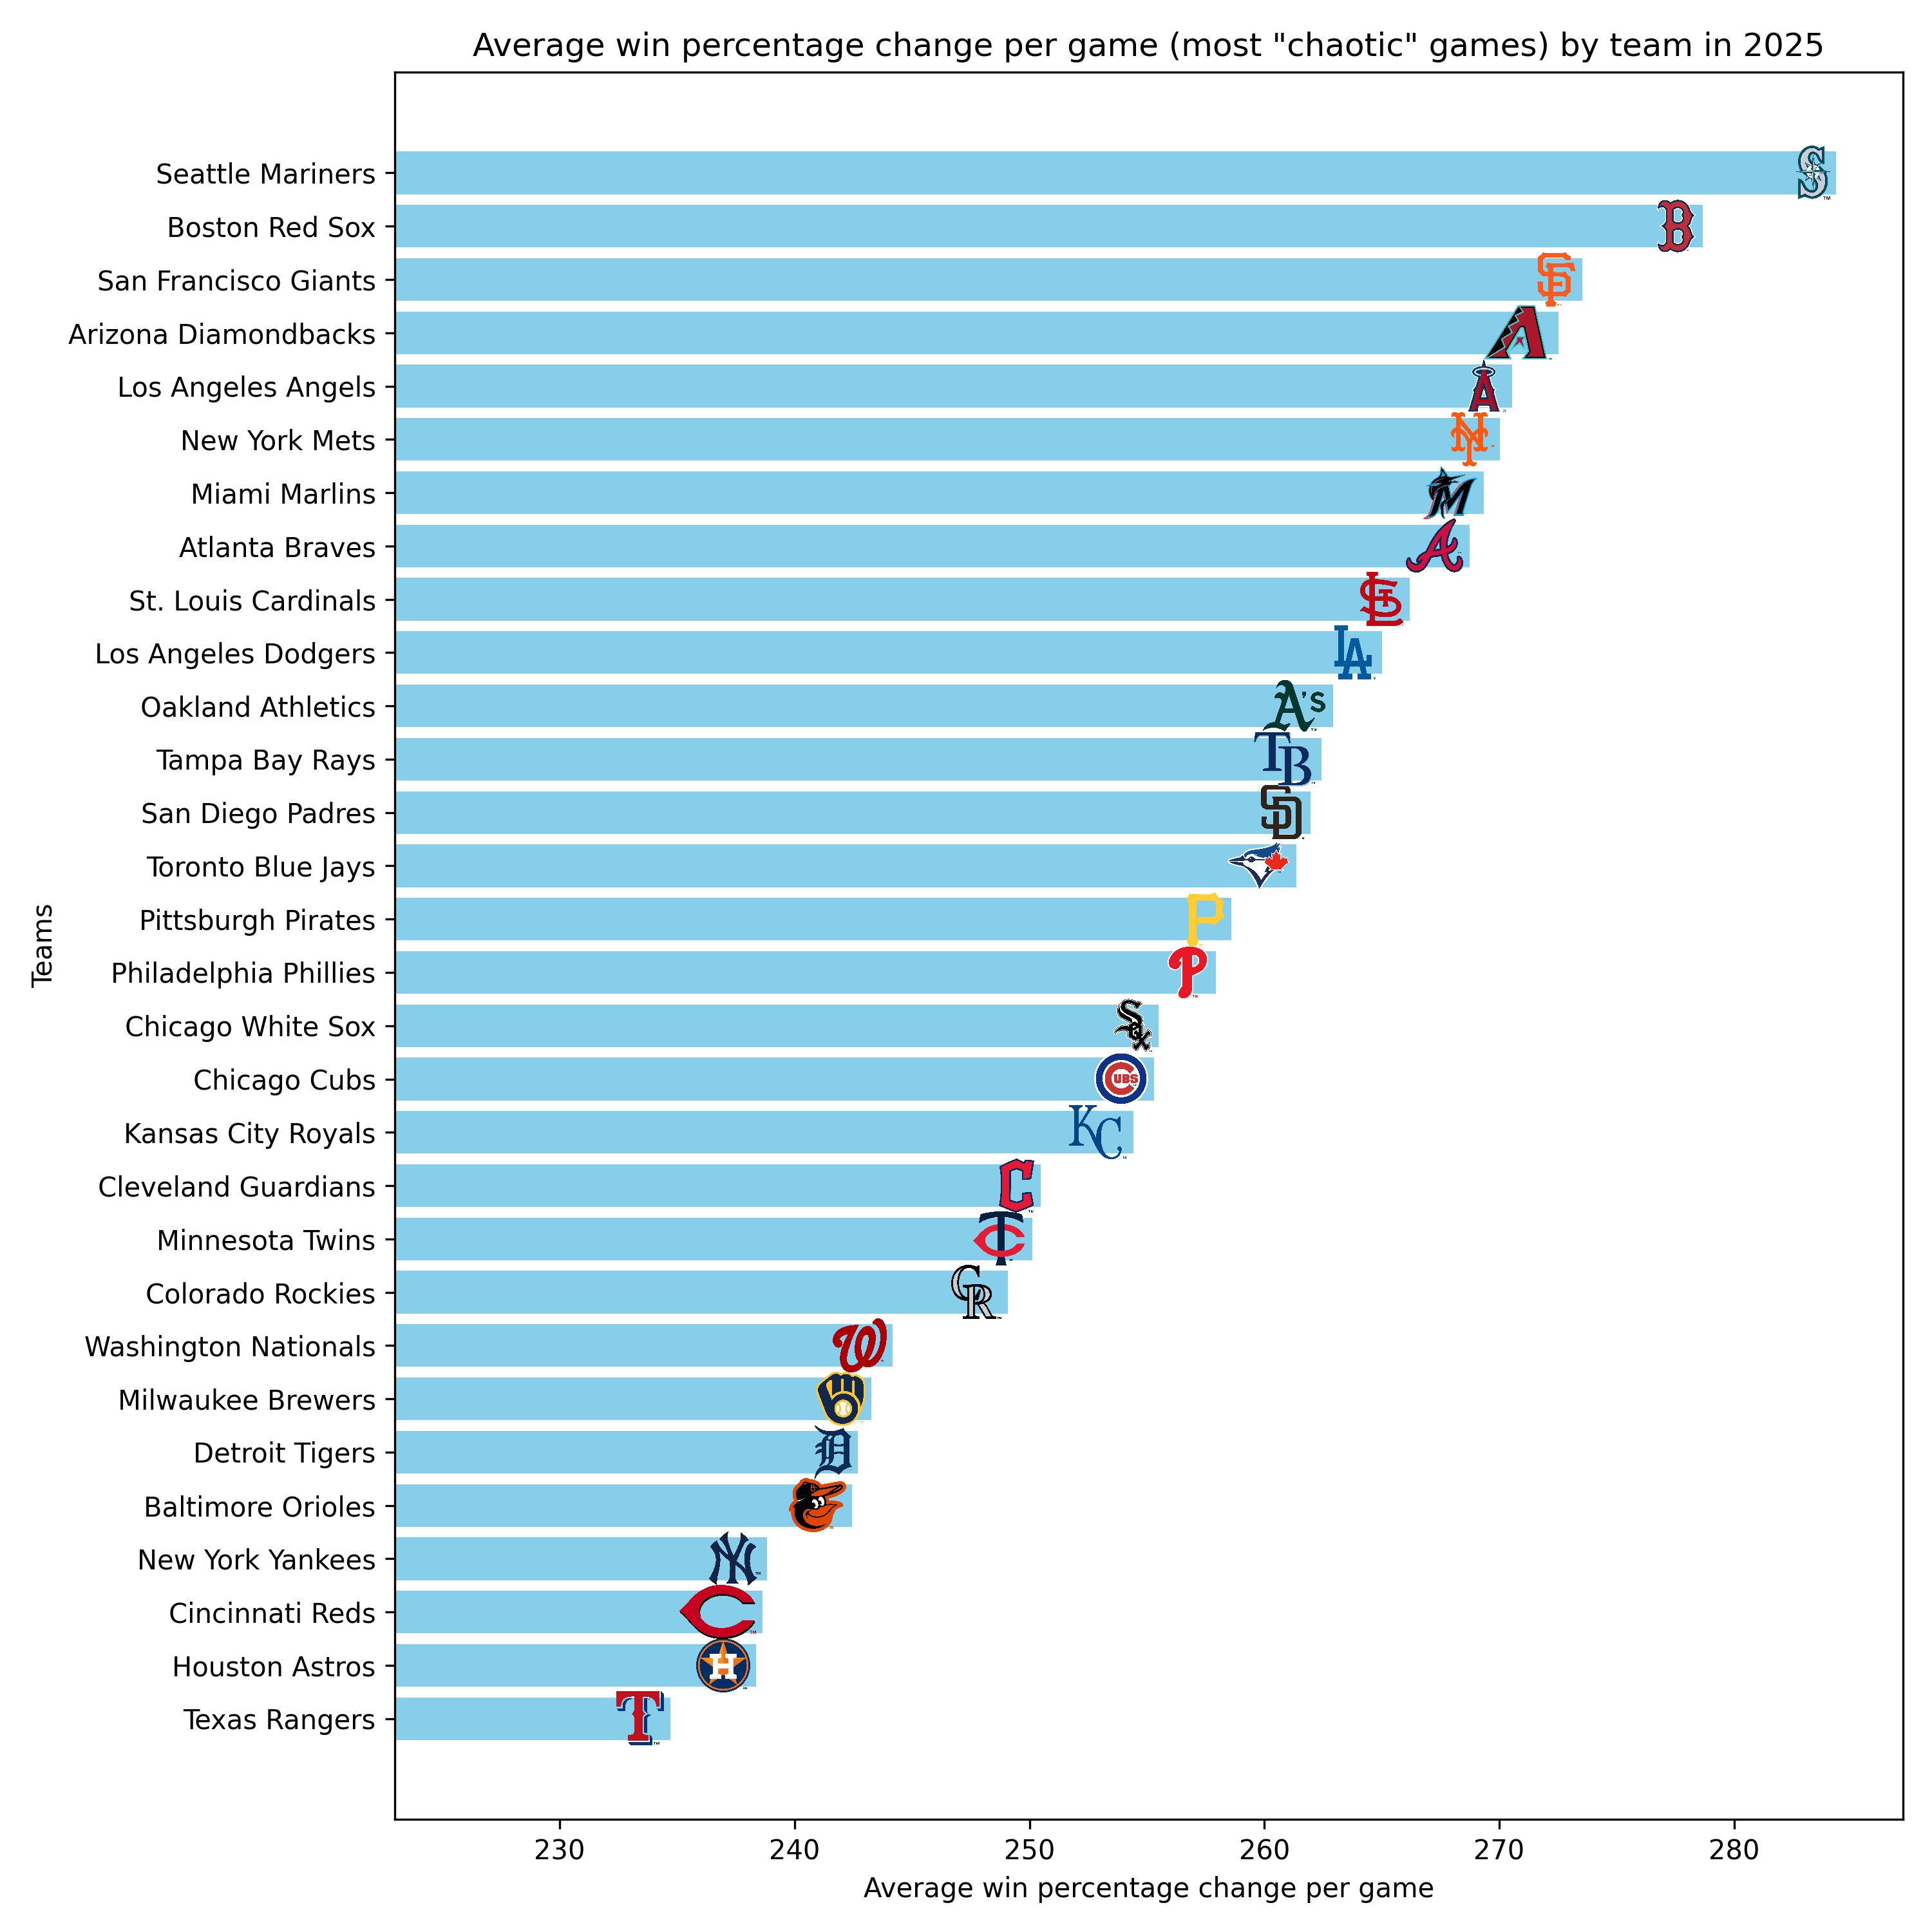
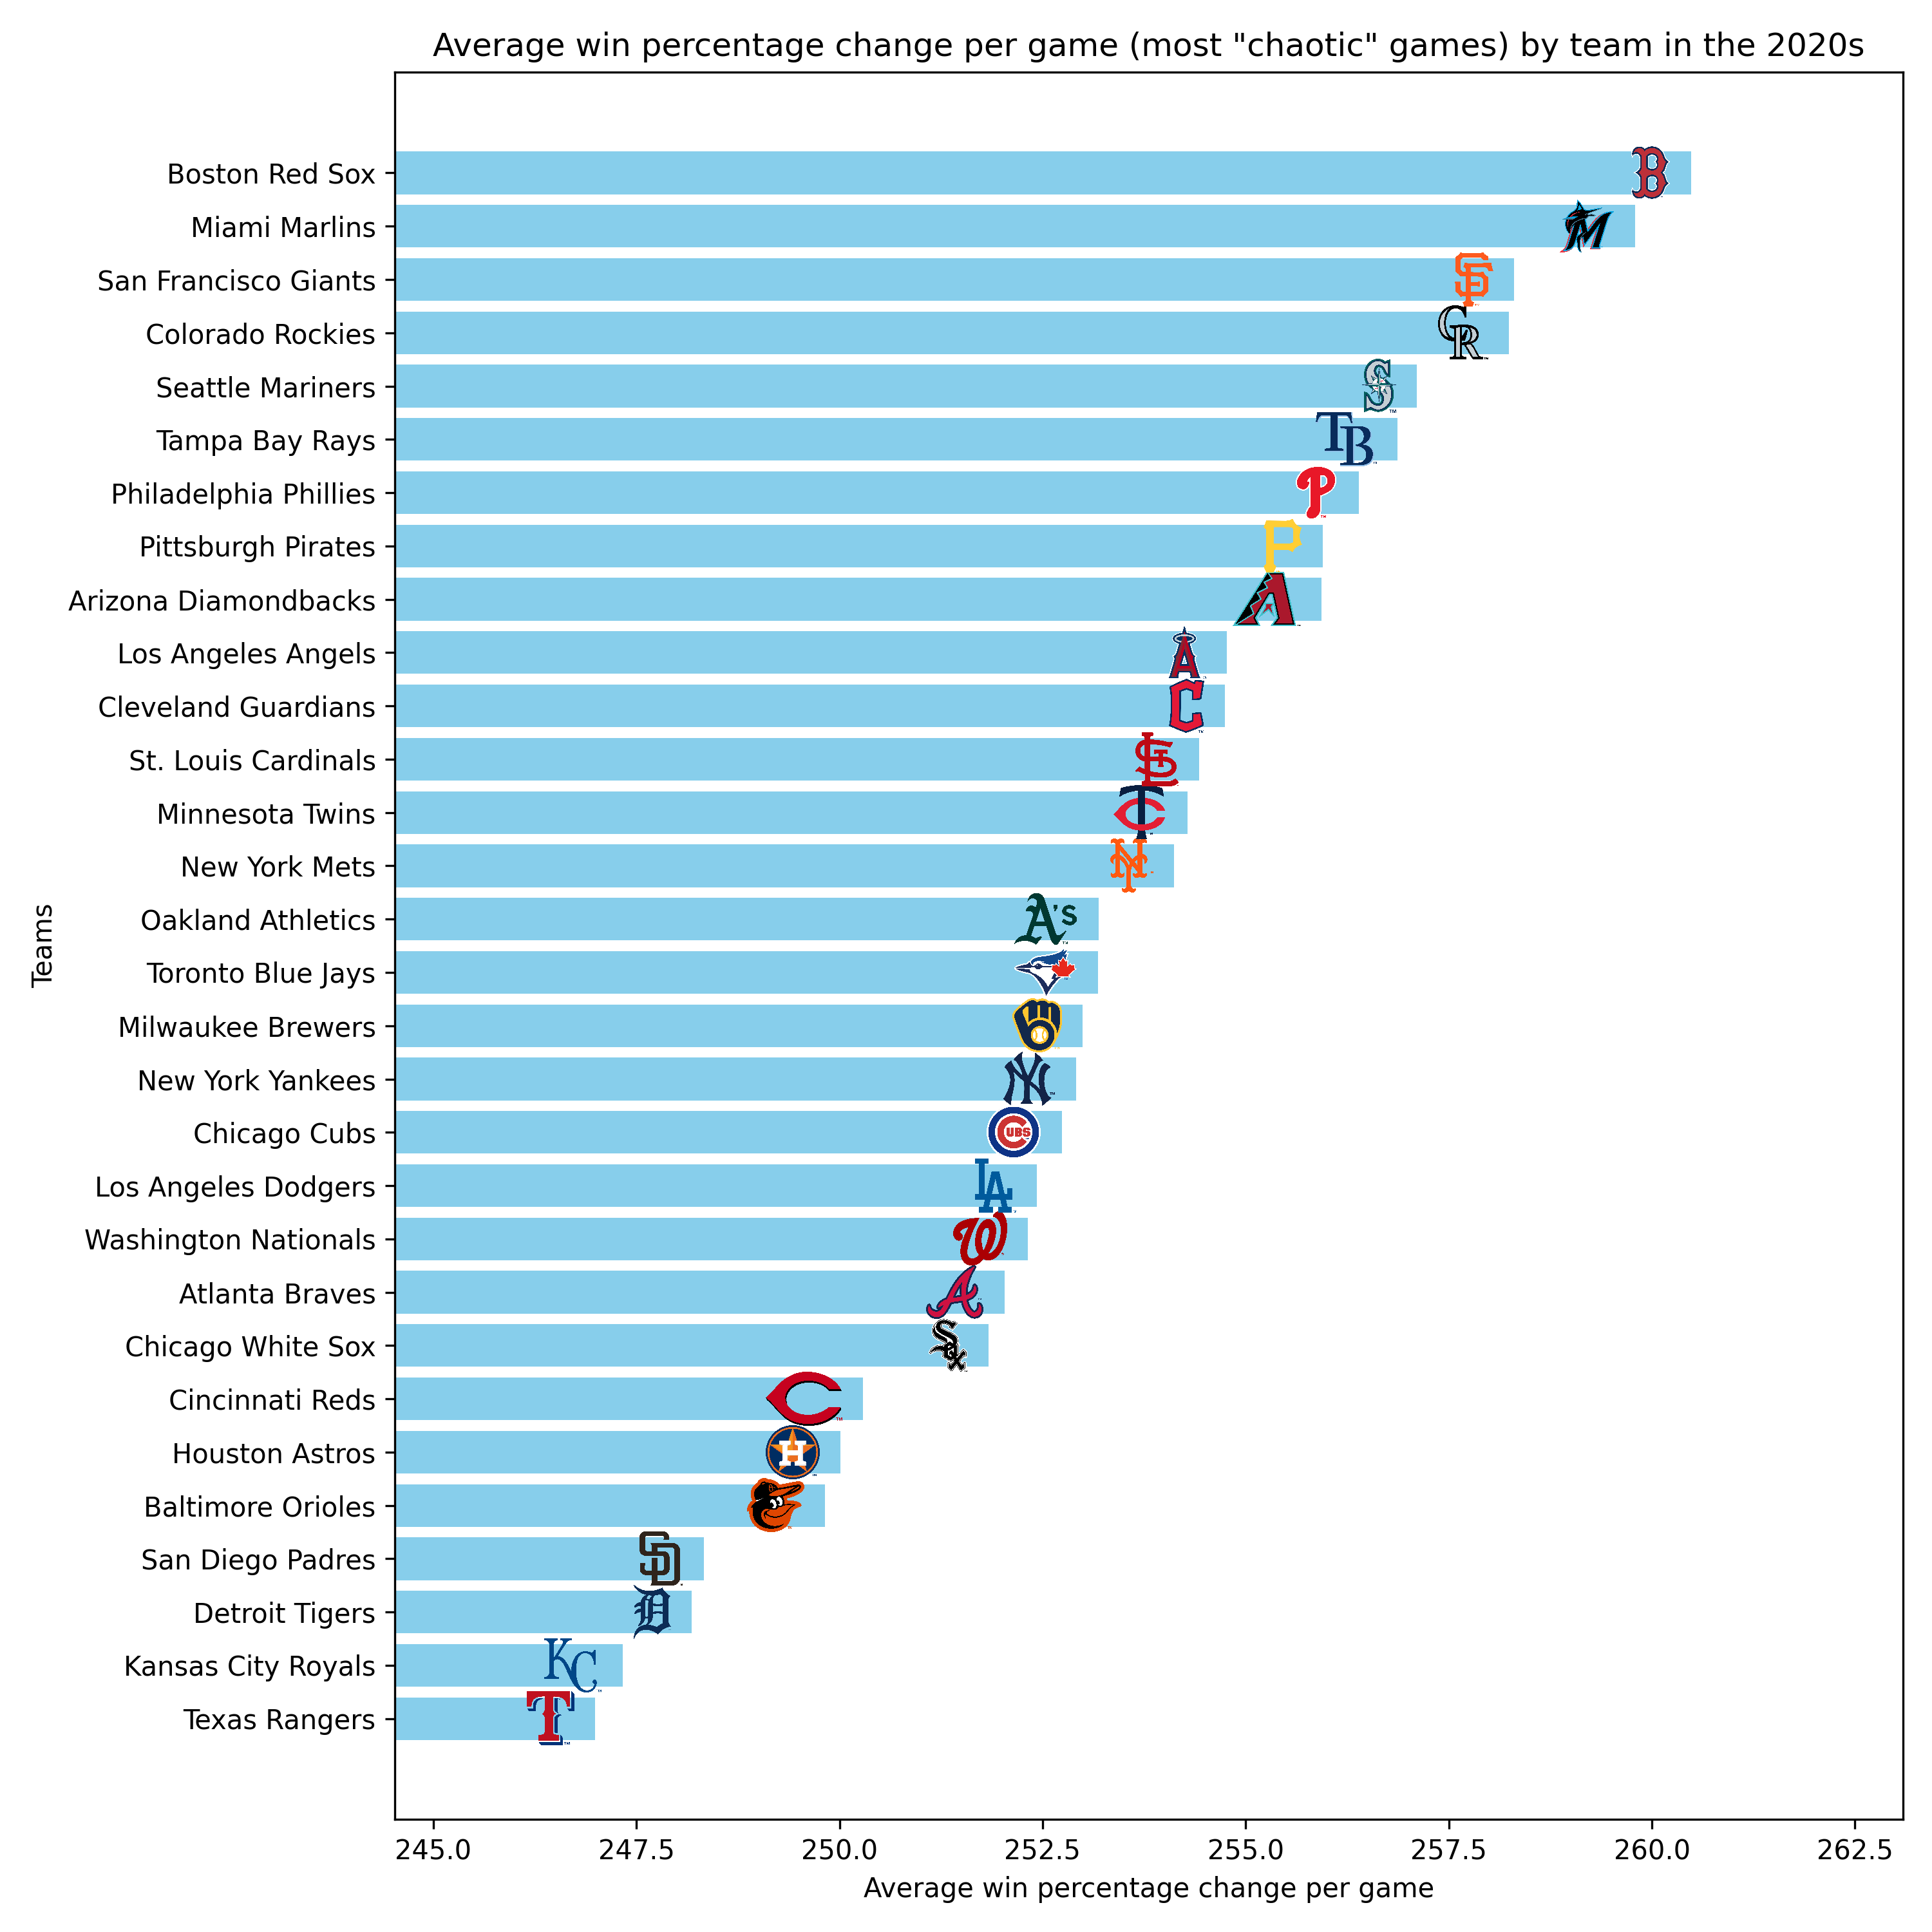
Using the sum of changes to win percentage per game, we can estimate how “chaotic” or “exciting” a team’s games have been.
Here’s an example from this 2025 season (through 6/18/25) and through the 2020s:
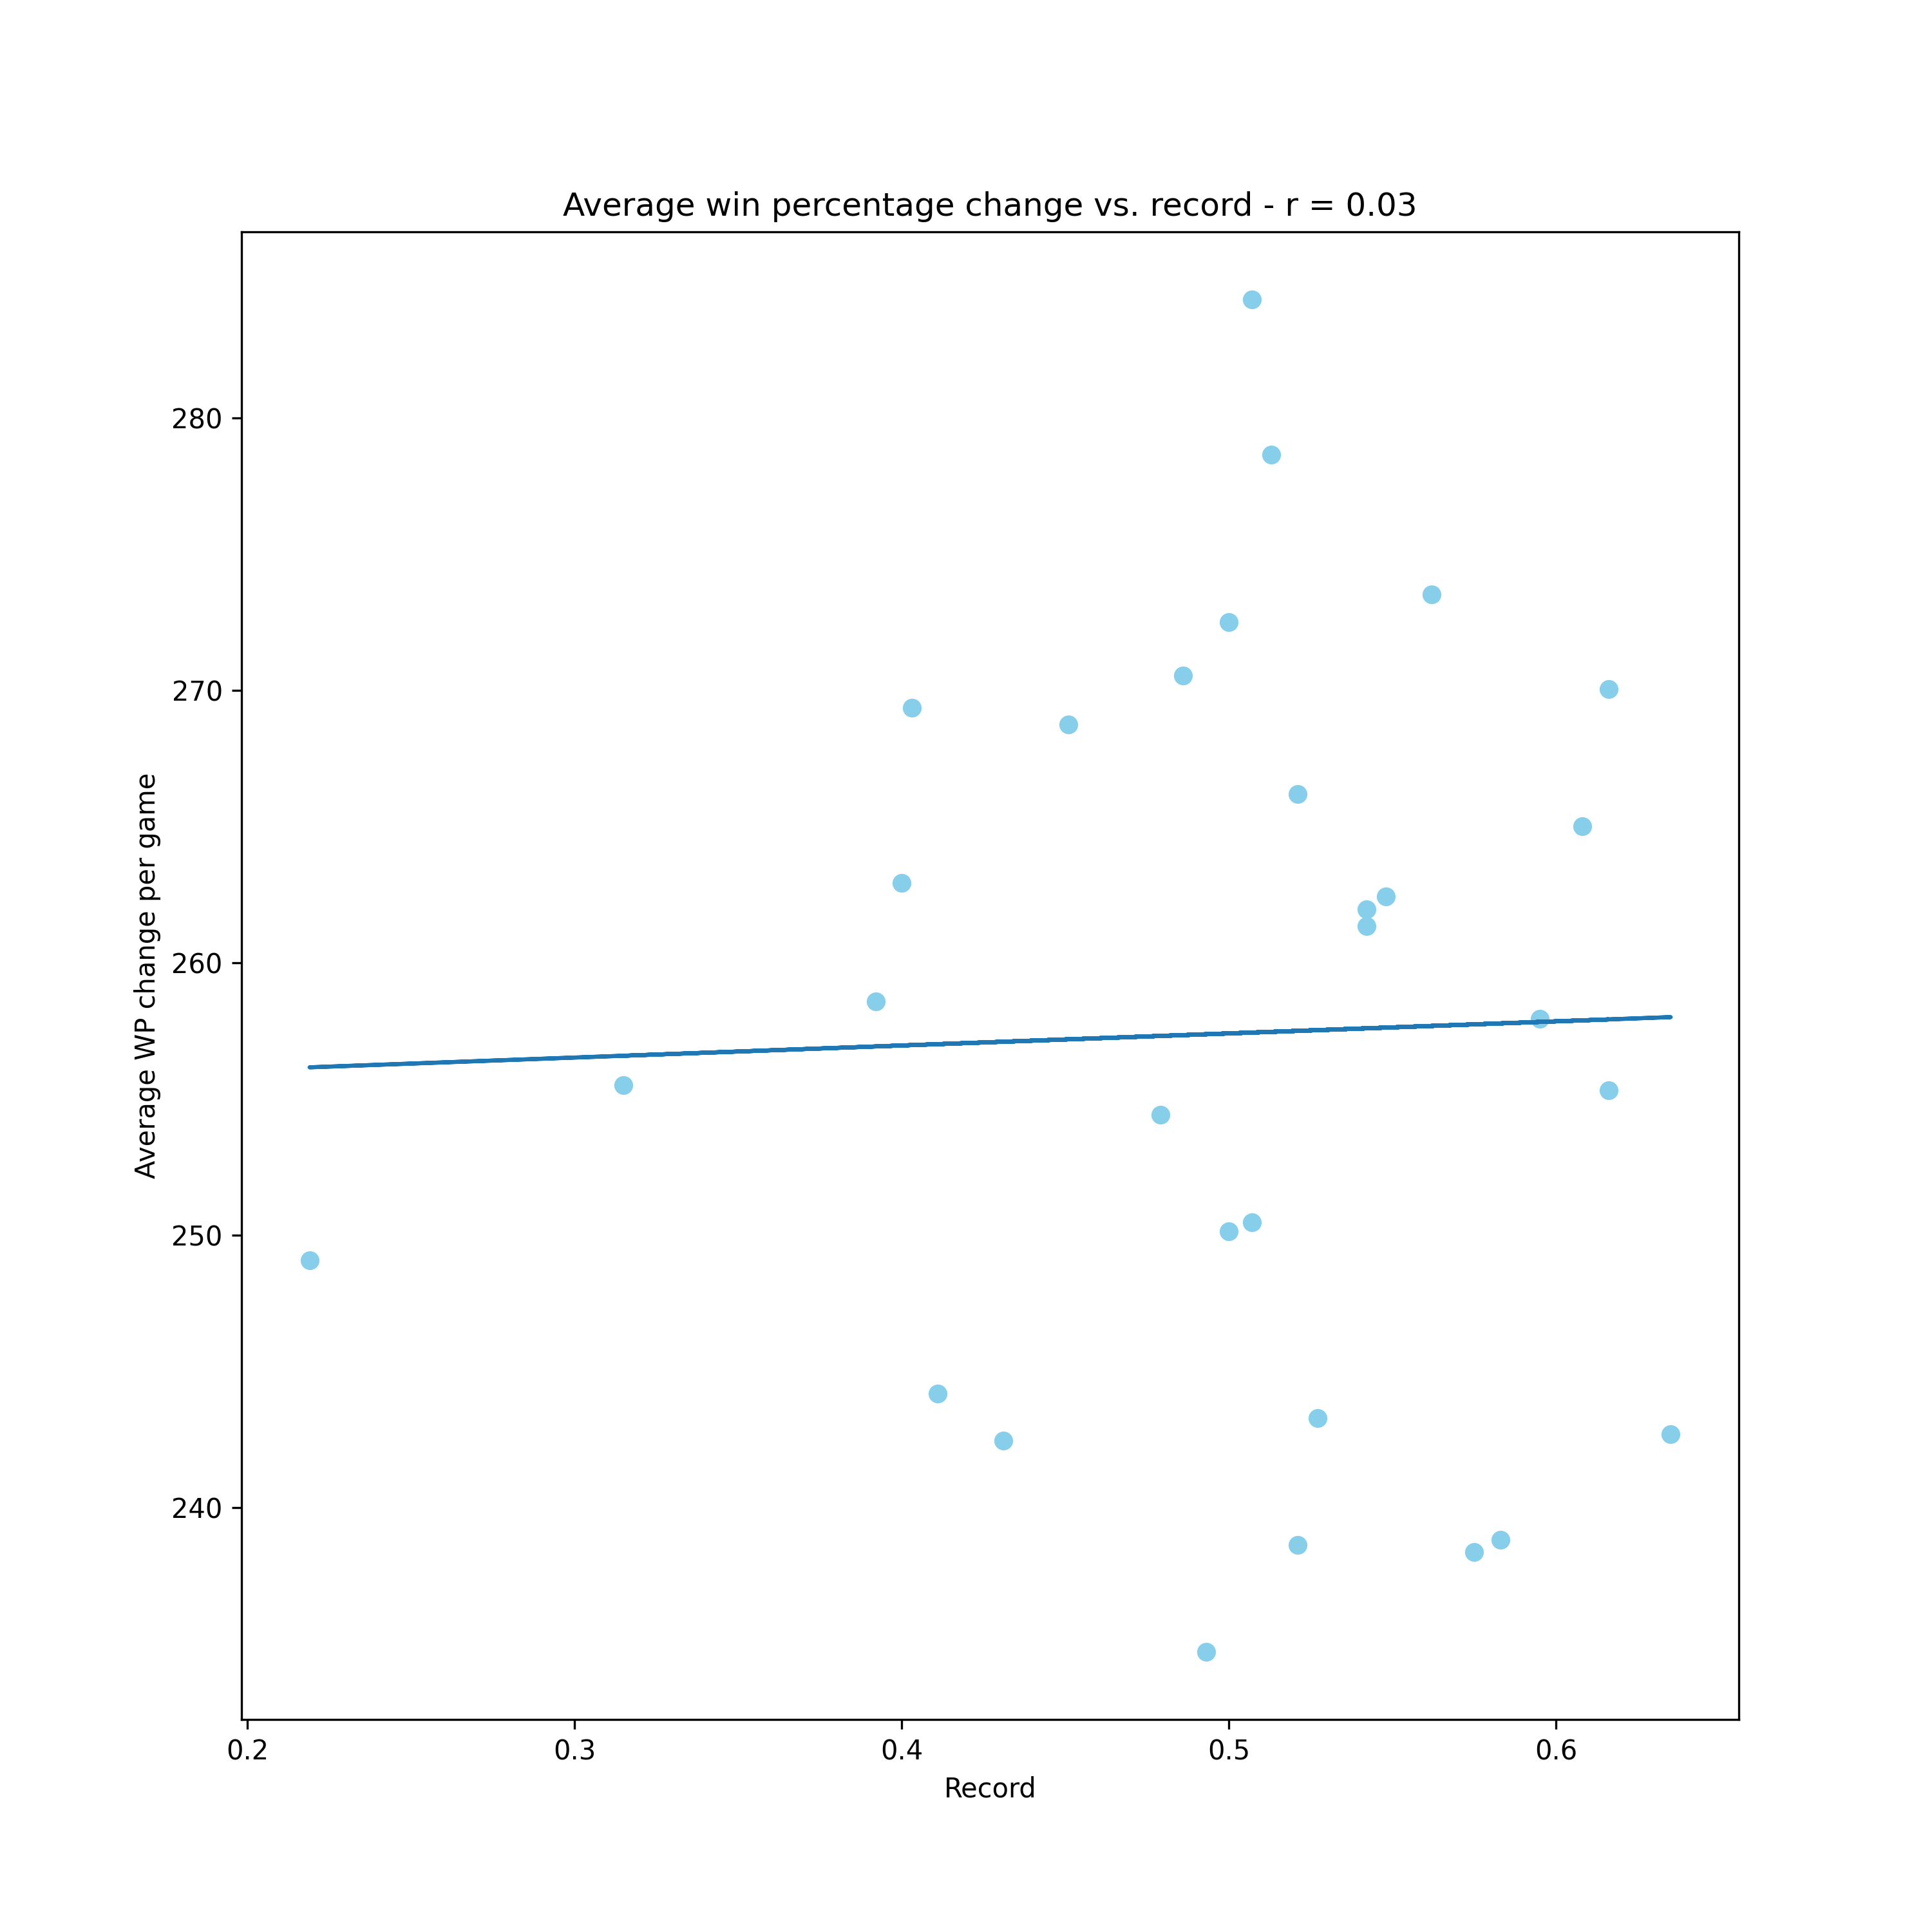
Interestingly, there’s no correlation between record and WP change:
Note: the following graphs are from ESPN, not MLB, and their estimates may vary slightly, but these graphs should illustrate the point.
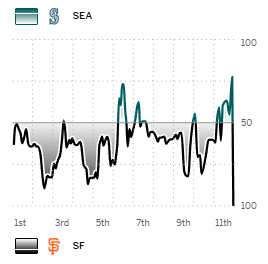
The most chaotic game of the year so far was 4/4/2025 between Seattle Mariners and San Francisco Giants, with a total WP change of 793.4. This game had many lead changes so the graph went crazy. Some big shifts in the graph were results of loading bases (which brings up win percentage a lot) and then stranding them on base (immediately wiping out those gains plus some).

The least chaotic game of the year so far was 4/20/2025 between the A’s and the Brewers, with a total WP change of 51.2 (50 being the minimum). The Brewers scoring 8 unanswered runs in the first 4 innings sealed the deal pretty quickly. It would take quite a lot to get a total WP change lower than this, because the only way I can picture getting to 50 exactly would require one team scoring several runs in a row, then only ever getting outs via sacrifices, as the run scored would probably outweigh the “cost” of getting out. Further analysis is necessary, of course.